Matplotlib:图形填充
区域填充函数有 fill(*args, **kwargs)和fill_between()
绘制填充多边形fill()
语法结构
fill(*args, **kwargs)

args - sequence of x, y, [color]

ax.fill(x, y)                    # a polygon with default color
ax.fill(x, y, "b")               # a blue polygon
ax.fill(x, y, x2, y2)            # two polygons
ax.fill(x, y, "b", x2, y2, "r")  # a blue and a red polygon
kwargs - 对象matplotlib.patches.Polygon的特性(class:~matplotlib.patches.Polygon properties)
示例
import numpy as np
import matplotlib.pyplot as plt

x = np.linspace(0, 5 * np.pi, 1000)

y1 = np.sin(x)
y2 = np.sin(2 * x)

plt.plot(x, y1, label="$ y = sin(x) $")
plt.plot(x, y2, label="$ y = sin(2 * x) $")
plt.legend(loc=3)

plt.show()

绘制填充图
import numpy as np
import matplotlib.pyplot as plt

x = np.linspace(0, 5 * np.pi, 1000)

y1 = np.sin(x)
y2 = np.sin(2 * x)

plt.fill(x, y1, color="g", alpha=0.3)
plt.fill(x, y2, color="b", alpha=0.3)

plt.show()

函数间区域填充fill_between
基本语法
两函数间的Y轴方向的填充
plt.fill_between(
    x, y1, y2=0, where=None,
    interpolate=False, step=None,
    hold=None, data=None,
    **kwargs
)
x- array( length N) 定义曲线的 x 坐标y1- array( length N ) or scalar 定义第一条曲线的 y 坐标y2- array( length N ) or scalar 定义第二条曲线的 y 坐标where- array of bool (length N), optional, default: None排除一些(垂直)区域被填充。 注:我理解的垂直区域,但帮助文档上写的是horizontal regions
也可简单地描述为
plt.fill_between(x,y1,y2,where=条件表达式, color=颜色,alpha=透明度)
" where = " 可以省略,直接写条件表达式
示例
import numpy as np
import matplotlib.pyplot as plt

x = np.linspace(0, 5 * np.pi, 1000)

y1 = np.sin(x)
y2 = np.sin(2 * x)

plt.plot(x, y1, c="g")
plt.plot(x, y2, c='r')

# 将两函数间区域填充成浅灰色
plt.fill_between(x, y1, y2, facecolor="lightgray")

plt.show()

我们看到,其实只要介于两函数值之间的区域均被 lightgray 颜色填充了。
进一步通过where = 条件表达式(这里的 where = 省略了 )该表图形 “ 形貌 ” 。
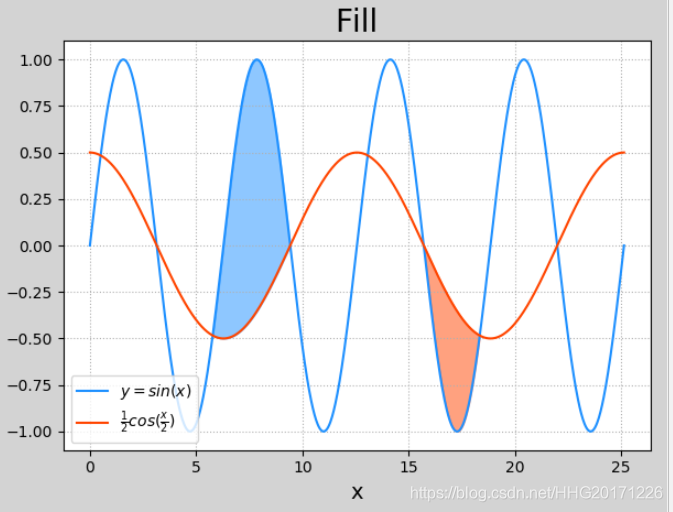
import numpy as np
import matplotlib.pyplot as plt
n = 1000
x = np.linspace(0, 8 * np.pi, n)
sin_y = np.sin(x)
cos_y = np.cos(x / 2) / 2

plt.figure('Fill', facecolor='lightgray')
plt.title('Fill', fontsize=20)
plt.xlabel('x', fontsize=14)
plt.ylabel('y', fontsize=14)
plt.tick_params(labelsize=10)
plt.grid(linestyle=':')

# 把正弦余弦两条曲线画出
plt.plot(x, sin_y, c='dodgerblue', label=r'$y=sin(x)$')
plt.plot(x, cos_y, c='orangered',
        label=r'$\frac{1}{2}cos(\frac{x}{2})$')

# 填充
plt.fill_between(x, cos_y, sin_y, cos_y < sin_y,
                color='dodgerblue', alpha=0.5)
plt.fill_between(x, cos_y, sin_y, cos_y > sin_y,
                color='orangered', alpha=0.5)

plt.legend(loc = 3)
plt.show()

指定区间填充
# 填充
plt.fill_between(x, cos_y, sin_y, where=(cos_y < sin_y)&(5<x)&(x<10),
                color='dodgerblue', alpha=0.5)
plt.fill_between(x, cos_y, sin_y, where=(cos_y > sin_y)&(15<x)&(x<20),
                color='orangered', alpha=0.5)
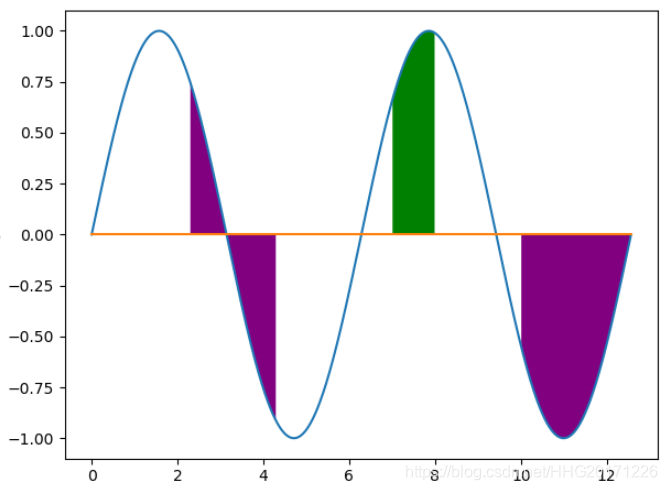
import numpy as np
import matplotlib.pyplot as plt

# 生成模拟数据
x = np.arange(0.0, 4.0 * np.pi, 0.01)
y = np.sin(x)

# 绘制正弦曲线
plt.plot(x, y)

# 绘制基准水平直线
plt.plot((x.min(), x.max()), (0, 0))

# 设置坐标轴标签
plt.xlabel('x')
plt.ylabel('y')

# 填充指定区域
plt.fill_between(x, y, where=(2.3 < x) & (x < 4.3) | (x > 10), facecolor='purple')

# 可以填充多次
plt.fill_between(x, y, where=(7 < x) & (x < 8), facecolor='green')

plt.show()
使用fill_betweenx在两条水平曲线之间着色。
    def fill_betweenx(self, y, x1, x2=0, where=None,
                      step=None, interpolate=False, **kwargs):
        """
        Fill the area between two vertical curves.

        The curves are defined by the points (*x1*, *y*) and (*x2*, *y*). This
        creates one or multiple polygons describing the filled area.

        You may exclude some vertical sections from filling using *where*.

        By default, the edges connect the given points directly. Use *step* if
        the filling should be a step function, i.e. constant in between *y*.


        Parameters
        ----------
        y : array (length N)
            The y coordinates of the nodes defining the curves.

        x1 : array (length N) or scalar
            The x coordinates of the nodes defining the first curve.

        x2 : array (length N) or scalar, optional, default: 0
            The x coordinates of the nodes defining the second curve.

        where : array of bool (length N), optional, default: None
            Define *where* to exclude some vertical regions from being
            filled. The filled regions are defined by the coordinates
            ``y[where]``.  More precisely, fill between ``y[i]`` and ``y[i+1]``
            if ``where[i] and where[i+1]``.  Note that this definition implies
            that an isolated *True* value between two *False* values in
            *where* will not result in filling.  Both sides of the *True*
            position remain unfilled due to the adjacent *False* values.
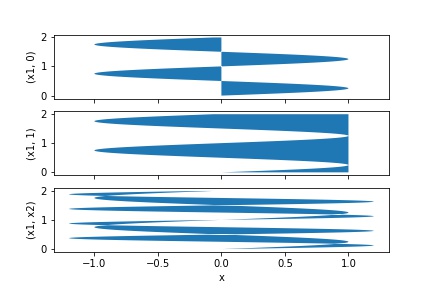
import matplotlib.pyplot as plt
import numpy as np

y = np.arange(0.0, 2, 0.01)
x1 = np.sin(2 * np.pi * y)
x2 = 1.2 * np.sin(4 * np.pi * y)

fig, [ax1, ax2, ax3] = plt.subplots(3, 1, sharex=True)

ax1.fill_betweenx(y, 0, x1)
ax1.set_ylabel('(x1, 0)')

ax2.fill_betweenx(y, x1, 1)
ax2.set_ylabel('(x1, 1)')

ax3.fill_betweenx(y, x1, x2)
ax3.set_ylabel('(x1, x2)')
ax3.set_xlabel('x')

plt.show()
fill_betweenx 的范围是纵坐标上
fill_betweeny 的范围是横坐标上

fill_betweenx 的参数应该输入(纵坐标的下限,纵坐标的上限,x 轴上的取值,颜色